Data Visualization Web Development Services
Ship Faster with Data Visualization Experts Trusted by High-Growth Teams
Our Data Visualization team has shipped hundreds of projects for fast-moving product teams. Every engineer on your project is senior-level — experienced enough to handle complexity without slowing you down.
AI tools we use:


Schedule a Strategy Call
Trusted by dozens of teams that don't compromise on talent.
Our Data Visualization Web Development Services
Swovo offers a variety of services for designing and building custom web applications.
Data Analysis
Our expert team provides in-depth data analysis to derive valuable insights and make informed business decisions.

Query Optimization
We optimize database queries for improved performance and efficiency in processing data.

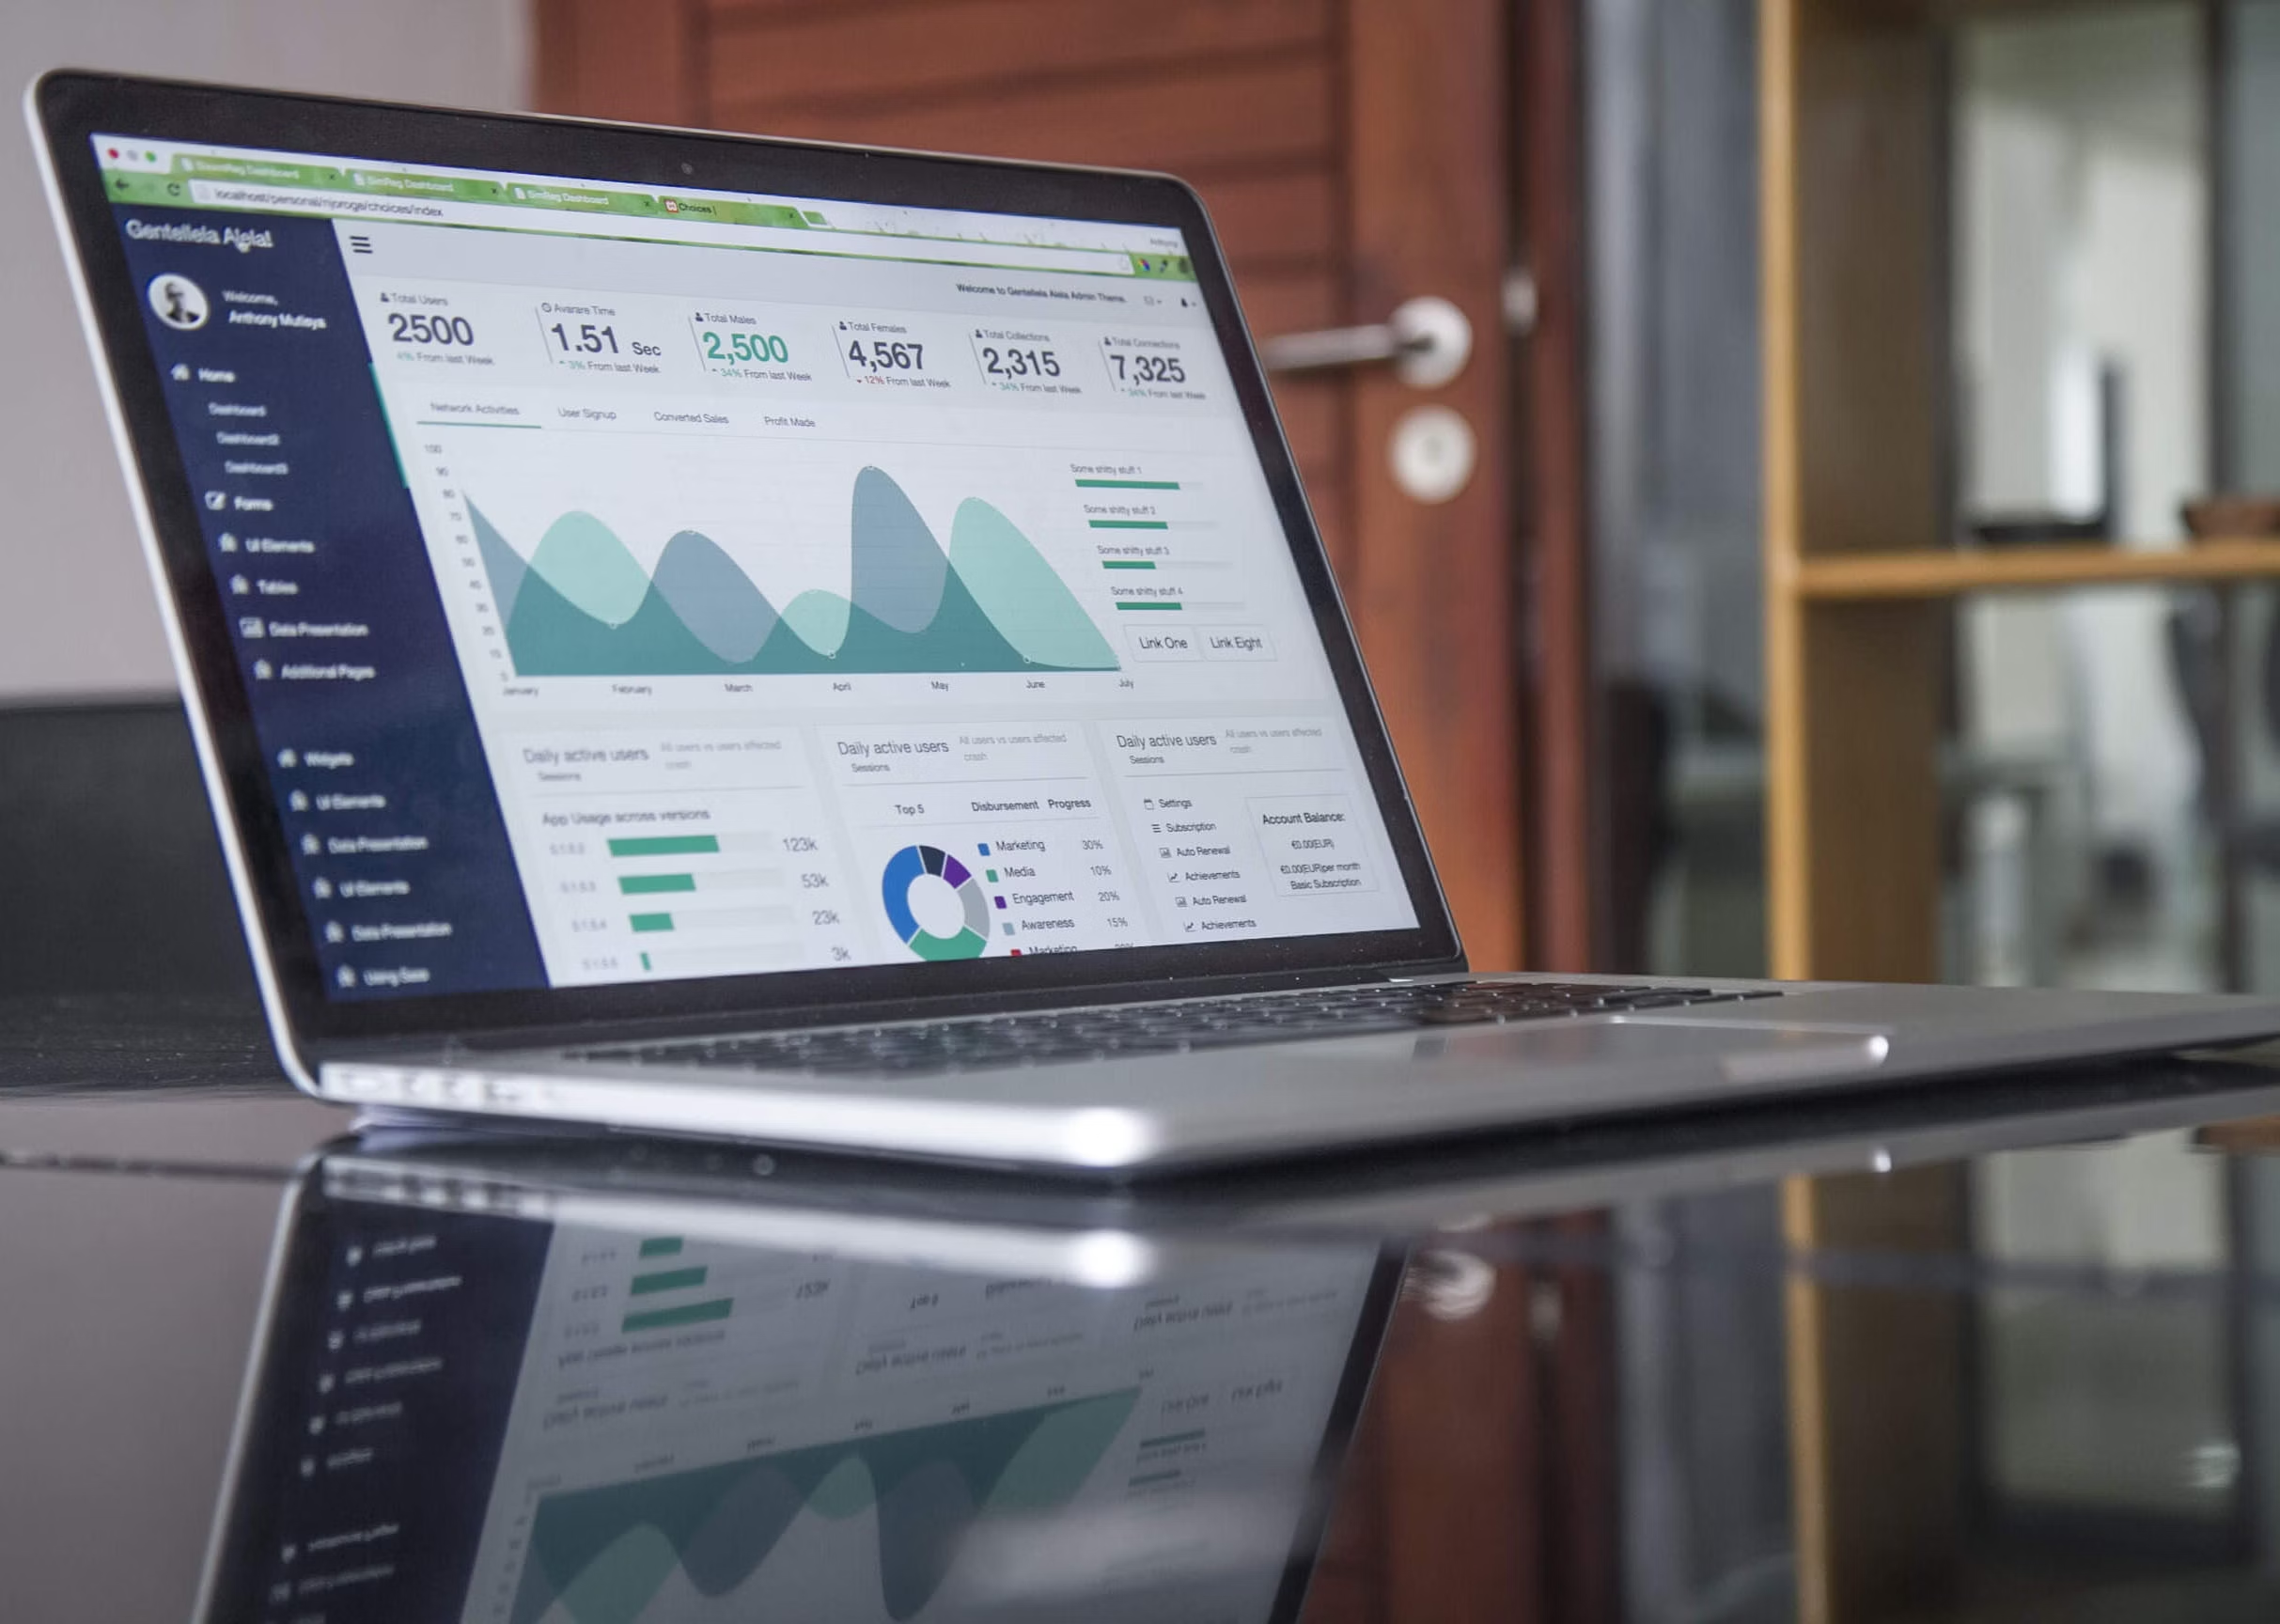
Data Visualization
Transform raw data into visually appealing charts, graphs, and interactive dashboards for better understanding and decision-making.

Business Intelligence
Utilize advanced analytics tools and techniques to gather, analyze, and visualize business data for strategic insights.

Database Migrations
Efficiently migrate data between different database systems while ensuring data integrity and minimal downtime.

Data Warehousing
Design and implement data warehousing solutions to securely store and manage large volumes of structured and unstructured data.
Data Visualization Case Studies
Dozens of Data Visualization projects delivered.
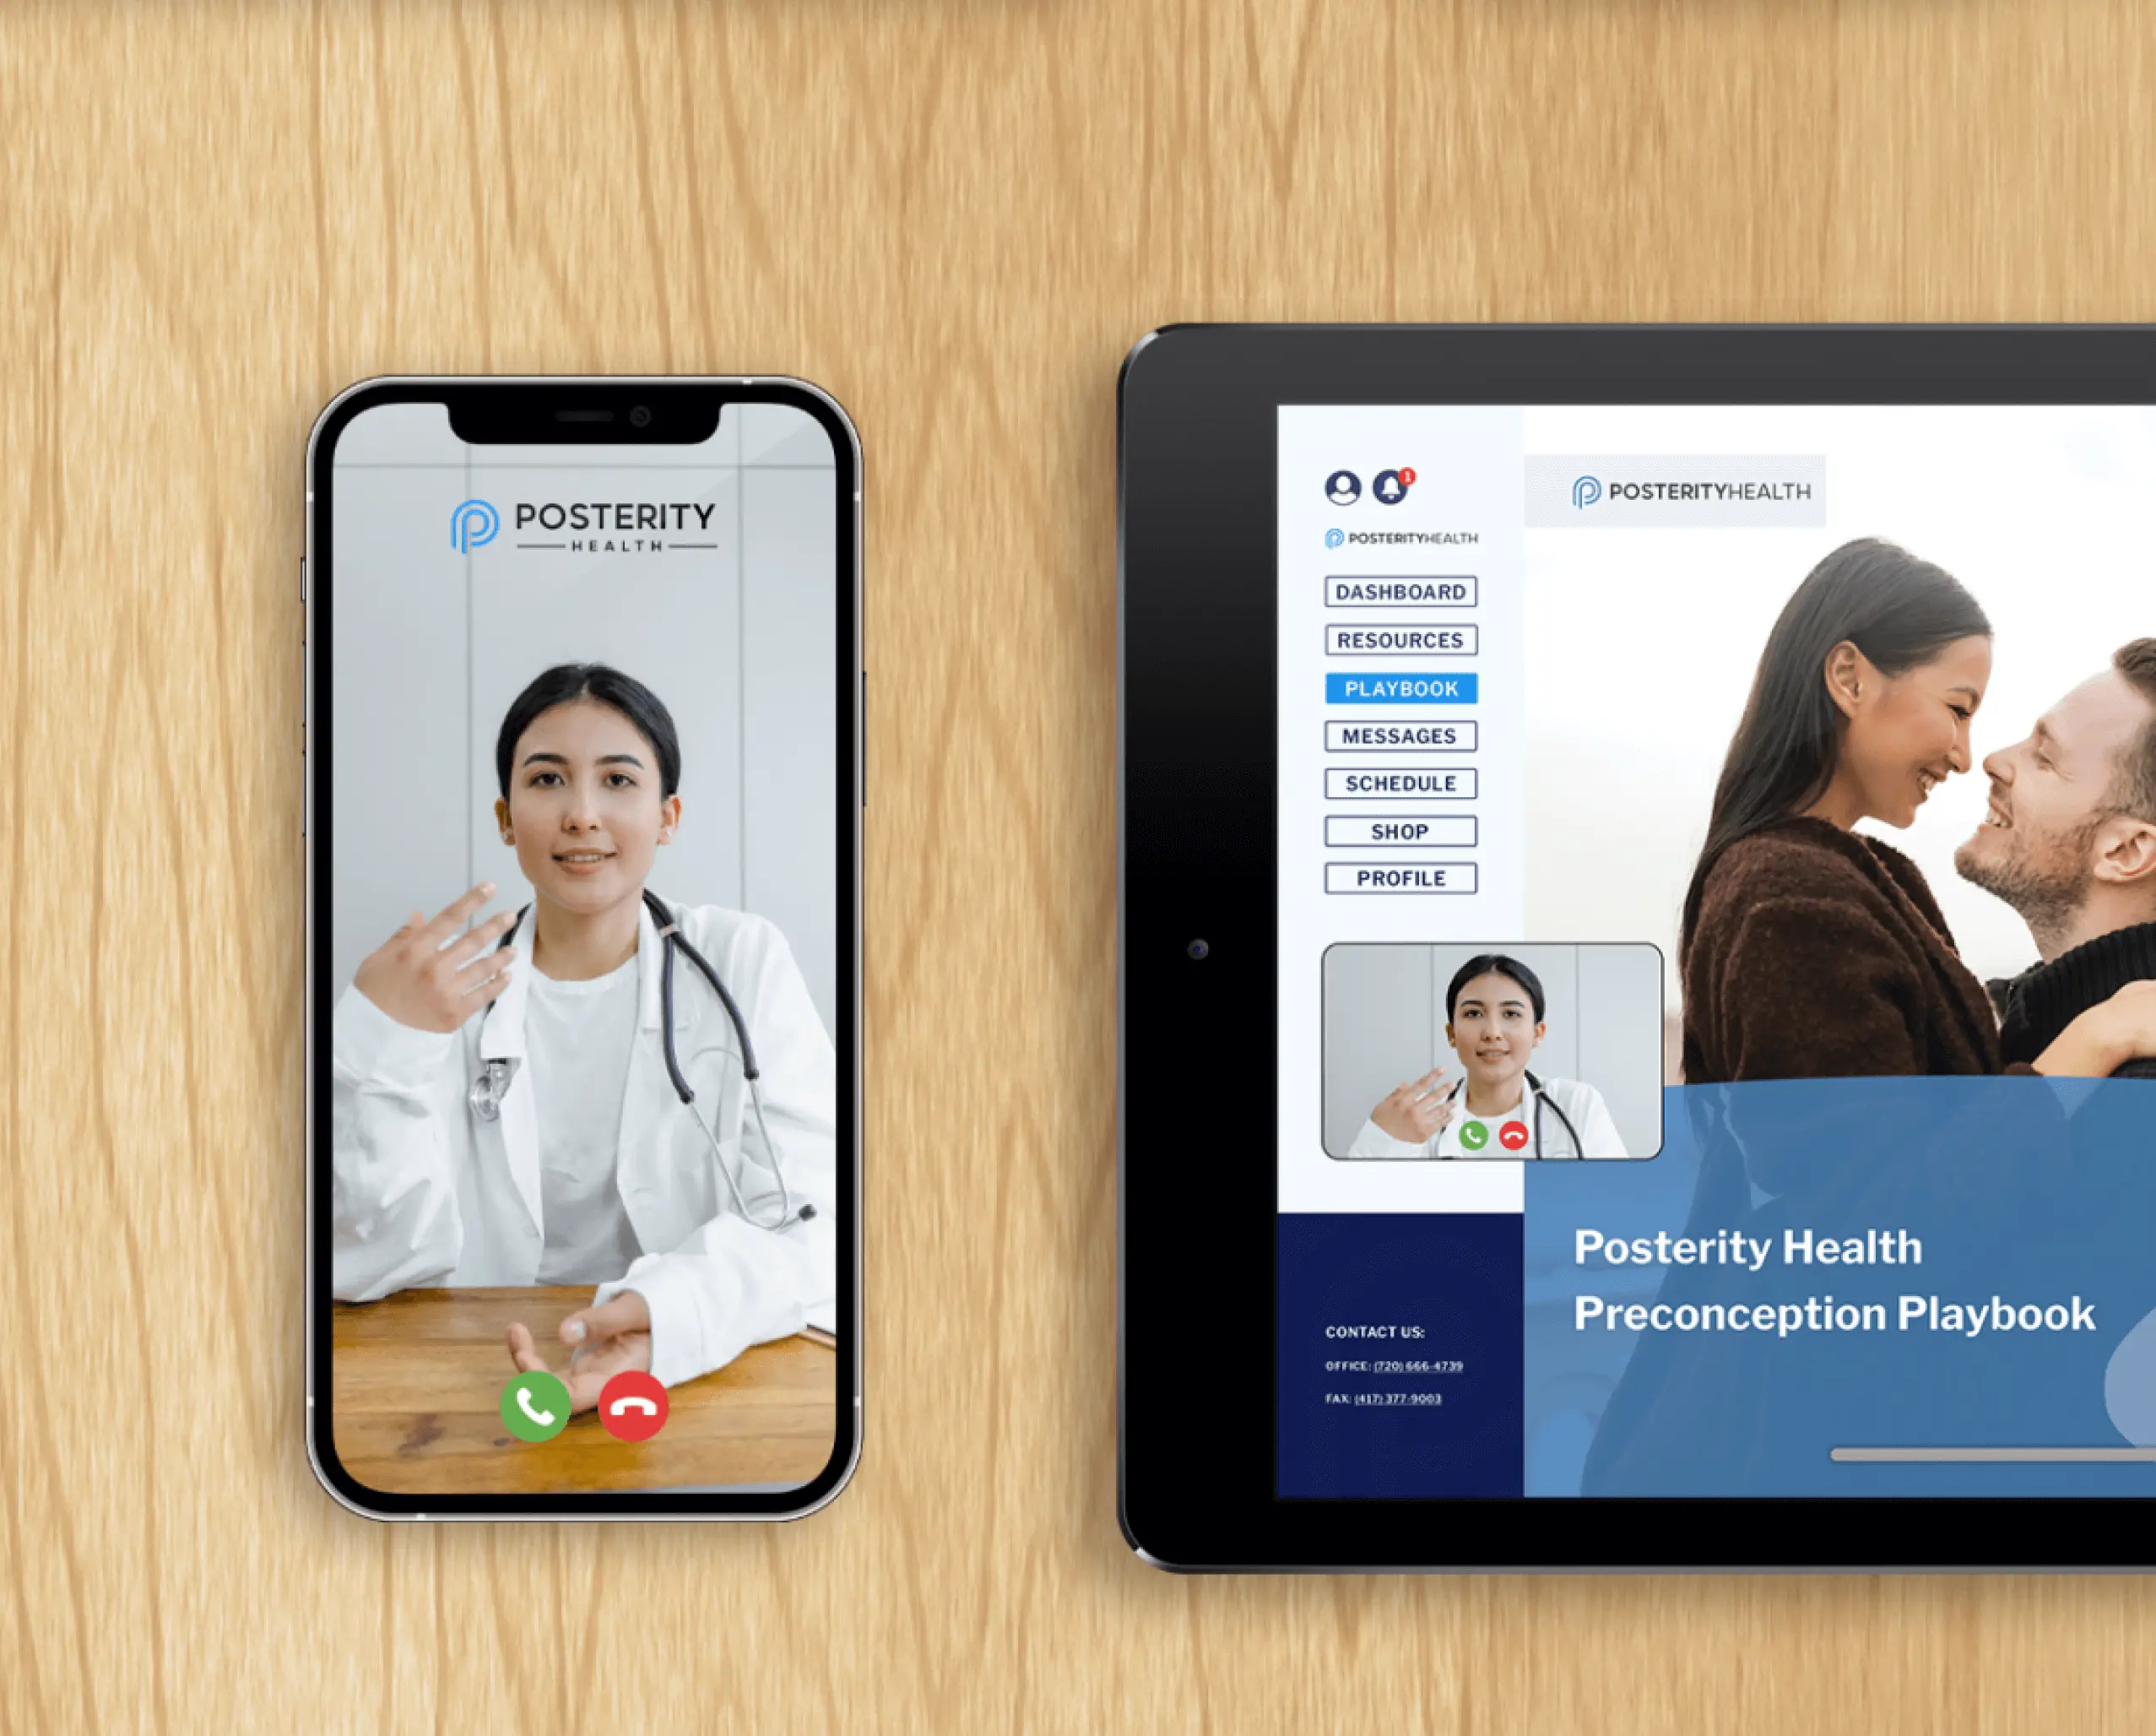
Predicting Weather with Long-Range Forecast Intelligence
Swovo partnered with Weather 20/20 to support platform development, DevOps, and project execution across a highly specialized long-range forecasting ecosystem. Our team improved platform reliability, accelerated technical problem-solving, and supported delivery of complex forecasting tools, APIs, and data visualization experiences used by organizations worldwide.
Scaled a Mobility Platform Serving Thousands of Daily Riders
A transportation startup needed to rapidly expand its ride-sharing platform while entering new markets. Swovo augmented the internal team before becoming a core product development partner — improving live tracking, route optimization, and rider workflows using React Native and AWS, while helping scale product capacity without slowing expansion.
Transformed a Trade Surveillance Platform into an Industry-Leading Product
A fintech company needed to relaunch its trade surveillance platform with a modern, intuitive UX for institutional users. Swovo redesigned the product from the ground up — simplifying complex workflows, improving usability across data-heavy interfaces, and delivering a scalable UX system aligned with the demands of financial compliance technology.

Built in Boulder. Trusted Worldwide.
Swovo is an award-winning boutique design and engineering consultancy founded in Boulder, Colorado. We started in 2018 with a simple goal: build exceptional design and engineering teams powered by top talent across Latin America.
Our 40+ person team operates across Brazil, Colombia, Argentina, and the Dominican Republic — delivering senior-level expertise with real-time collaboration for US-based companies.
From early-stage startups to enterprise platforms, we help teams move faster without compromising quality.
80
80
Nps
3+
3+
Client relationship
5.0
5.0
Clutch rating
50+
50+
Industry awards

Types of Web Apps we Create


Our Process for Web Projects

01
Scoping
We have detailed discussions to understand your requirements, objectives, and challenges.

02
Proposal
We provide you with a proposal that outlines scope, timelines, required resources, and costs.

03
Contract
A contract formalizes our relationship and commitment to delivering the agreed-upon services.

04
Execution
We kick off the project by dedicating our resources to design and implement the software solution.
A trusted partner for your business.

“Our company is growing, and as we started looking to scale, we wanted a more efficient business model. We hired Swovo to build a platform that would help connect talent with the right company.”
Brian Bar
Founder and CEO

“They deconstructed our idea and provided it back to us in an incredibly smart and accessible manner. Swovo is constantly solving problems in both a visually stunning and intelligent way.”
Storey Jones
Founder and CEO

“With the help of Swovo, we were able to launch a large update to our platform, introducing new innovative tools for our clients. The information was complex but Swovo found creative ways to present it, making it feel simple and easy to understand.”
Jeremy Zaborowski
Co-Founder & CTO

“Swovo's work optimized site design and flow. The creative lead at Swovo demonstrated exceptional UX know-how, integrating usability and design to deliver a powerful product. The client came out of the engagement with a wider understanding of the most important platform features.”
Heidi Hildebrandt
Director of Product
Our Web Development Technologies

Power BI
Power BI is a business analytics service by Microsoft that provides interactive visualizations and business intelligence capabilities.
Tableau
Tableau is a leading data visualization and business intelligence platform that helps organizations analyze and visualize data effectively.
Python
Python is a versatile programming language widely used for artificial intelligence, data analysis, and backend development.

R
R is a programming language and free software environment for statistical computing and graphics, highly favored among statisticians and data miners.
Our Web Development Engagement Models
We offer flexible engagement models for each business.Why Choose Swovo for Web Development?
Expertise in Data Visualization
Our team specializes in creating visually appealing and informative data visualizations for web applications, helping you make sense of complex data sets.

Customized Solutions
We tailor our data visualization services to fit your specific requirements, ensuring that the solutions are tailored to your unique needs.

Interactive Dashboards
We design interactive dashboards that allow users to explore data dynamically and gain insights efficiently.

Scalable Solutions
Our data visualization solutions are scalable, capable of accommodating growing data needs and ensuring long-term usability.

Data-driven Decision Making
With our data visualization services, you can empower data-driven decision-making processes within your organization, leading to better outcomes.

Experienced Team
Our team has extensive experience in data visualization web development, ensuring top-notch quality and expertise in every project.